


SUNS-cfr
Created: February 2025
Any questions can be directed to [email protected].
Environment Setup
System Requirements
We recommend using Ubuntu 24.04. Other operating systems may work, but this tutorial is built on Ubuntu 24.04.
Install Docker
SUNS-Dataset requires Docker to run analysis tools. Follow the instruction for your operating system.
If you are using Ubuntu 24.04, feel free to use the script provided.
# Add Docker's official GPG key:
sudo apt-get update
sudo apt-get install ca-certificates curl
sudo install -m 0755 -d /etc/apt/keyrings
sudo curl -fsSL https://download.docker.com/linux/ubuntu/gpg -o /etc/apt/keyrings/docker.asc
sudo chmod a+r /etc/apt/keyrings/docker.asc

# Add the repository to Apt sources:
echo \
  "deb [arch=$(dpkg --print-architecture) signed-by=/etc/apt/keyrings/docker.asc] https://download.docker.com/linux/ubuntu \
  $(. /etc/os-release && echo "${UBUNTU_CODENAME:-$VERSION_CODENAME}") stable" | \
  sudo tee /etc/apt/sources.list.d/docker.list > /dev/null
sudo apt-get update

# Install Docker
sudo apt-get install docker-ce docker-ce-cli containerd.io docker-buildx-plugin docker-compose-plugin

# Test Docker
sudo docker run hello-world
Add Self to Docker Group
Since we want to use Docker without root, add yourself to the docker group.
Make sure you are not root!
sudo usermod -aG docker `whoami`
Refresh Groups
Log out and log back in to see yourself in the group. You should see docker when you run groups. You can now confirm that you can run docker run hello-world without sudo.
Pull suns-dataset from Github
If you already have git installed, proceed to pull suns-dataset from the Github repository.
git clone https://github.com/Program-Understanding/suns-dataset.git
Programs
What is Control Flow Recovery?
In a truly simple program, a disassembler should be able to start from the entry point and trace the code all the way down to the end of the program. Unfortunately, real programs have constructs that make this challenging. These are called Indirect Control Flow (ICF).
For our work, we want to create some examples that will help us discover where exactly the boundaries are of current analysis tools.
Function Pointer Array
One of the most direct ways of introducing indirection is by creating a function pointer.
Take a look at the following source code.
#include <stdio.h>

int target1(int a, int b) { return a + b; }
int target2(int a, int b) { return a - b; }
int target3(int a, int b) { return a * b; }

typedef int (*fptr)(int, int);

int main() {
    fptr fptr_arr[3] = { target1, target2, target3 };

    char buf[64];
    printf("Input two integers: ");

    if (fgets(buf, sizeof(buf), stdin) == NULL) {
        printf("Error reading input.\n");
        return 1;
    }

    int a, b;
    if (sscanf(buf, "%d %d", &a, &b) != 2) {
        printf("Invalid input. Please enter two integers.\n");
        return 1;
    }

    for (int i = 0; i < 3; i++) {
        int val = fptr_arr[i](a, b);
        printf("%d\t", val);
    }

    printf("\n");
    return 0;
}
We have three functions intentionally named target to make later work easier. We also see an array of pointers! Instead of calling target1, target2, or target3 directly, we decide to place the addresses of these functions in an array and then execute each function with integers a and b.
Directory Layout
There are various software constructs that produce indirection. A function pointer array is one of the most direct ways of producing them, but other constructs include callbacks, switch statements, inheritance, et cetera.
Since we created an example that creates a function pointer array, we will save it in suns-dataset/control_flow_recovery/common_challenges/arrays_of_function_pointers.
For better organization, it might be useful to create a directory here to distinguish it from other challenges with the same construct. I will name mine enya-fptr_array.
Compilation
Follow the command sequence for guidance on how to name files and compile.
gcc -g -O2 enya-fptr_array.c -o enya-fptr_array
cp enya-fptr_array enya-fptr_array-stripped
strip enya-fptr_array-stripped
Challenge
- Create a directory in
suns-dataset/control_flow_recovery/common_challenges/arrays_of_function_pointers/namedYOUR_NAME-fptr_array. - Create a C file that implements a function pointer array named
YOUR_NAME-fptr_array.c. Try different parameters or different functions! - Compile with
-O2 -gand test your program to make sure it works.
CFR File
To create a research question, you first need a CFR file.
CFR.json
To work with the tools in control_flow_recovery/analysis, you will need a proper -cfr.json file. Go ahead and create one as such:
touch enya-fptr_array-stripped-cfr.json
Notice the -cfr.json at the end of the file name. This is critical for the parser in tools.
{
    "program":"enya-fptr_array-stripped",
    "question":"What are the file offsets for the instructions that are the targets of the '$INSTRUCTION' instruction at file offset '$OFFSET' ?",
    "groundtruth": [],
    "evaluation":"set"
}
The four necessary fields are program, question, groundtruth, and evaluation. The program is a relative filepath to the -cfr.json. The question requires exact wording as tools currently rely on regex. The groundtruth contains the answers to the questions, and the evaluation is the format of the answers.
Other helpful fields can be added as an aid to a human viewer.
Formatting Questions and Finding Ground Truth
Finding the question when the program is simple is easy enough. Fortunately, we are very interested in minimal examples.
Objdump is a great tool that can help with this. One good news is, since we are working with ELF binaries compiled by GCC, Objdump already gives to us the file offset. Even better news is, stripping a binary does not affect the code sections, so we can use the same offsets we find in the non-stripped for the stripped.
objdump -d enya-fptr_array
Since we have our function calls in main, we should check for a call to a pointer. Objdump will make this obvious, and in our case, it was call *(%rbx) at offset 0x11b5.
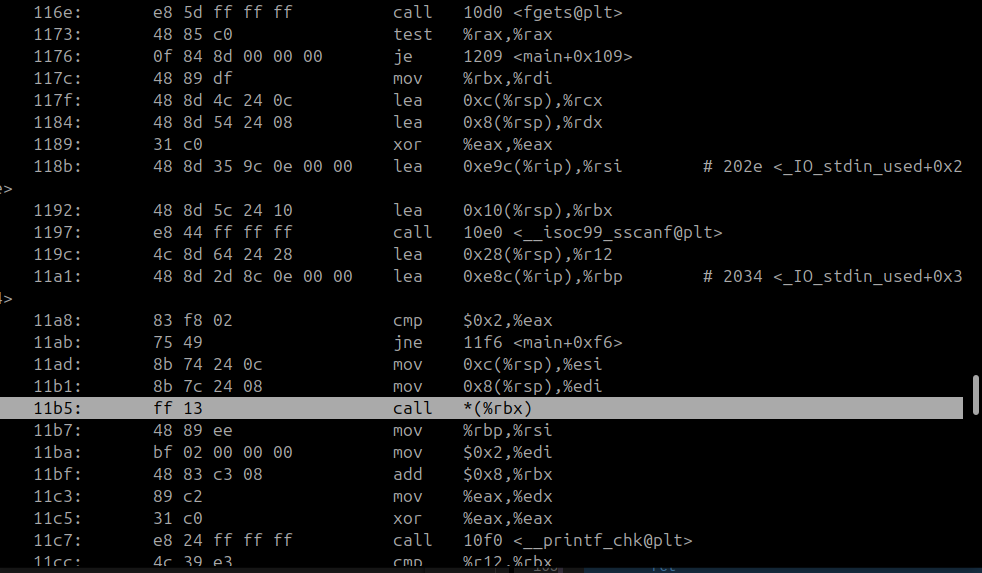
The target of these calls are similarly also easy to find:
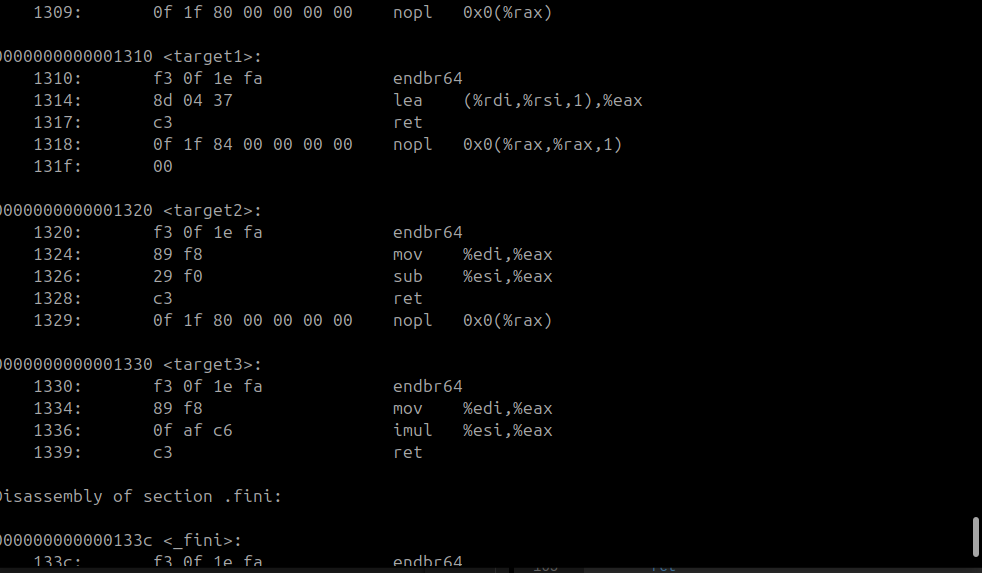
From the examples above, it is clear that they are 0x1310, 0x1320, and 0x1330.
Then we should be able to update our -cfr.json file with these offsets.
{
    "program":"enya-fptr_array-stripped",
    "question":"What are the file offsets for the instructions that are the targets of the 'call rbx' instruction at file offset '0x11b5' ?",
    "groundtruth": ["0x1310", "0x1320", "0x1330"],
    "evaluation":"set"
}
Run the validator script to confirm that the analysis tools will be able to find your CFR file.
cd ~/suns-dataset/control_flow_recovery/analysis
./validate_cfr_files
Then use ./show_me_all_the_questions to verify that at least one tool can process your question.
./show_me_all_the_questions
Challenge
- Create your own CFR file
- Validate your CFR file with the two helper scripts (make sure it works!)
- Once you have obtained good results with the two validators, push your new program directory to Github
Analysis
Building Tools
In control_flow_recovery/analysis/tools, you will see various tools that support certain questions. You can find the questions a tool can handle with their respective questions.json located in its directory.
Building the tools is as simple as running the ./build script in each directory.
For example:
cd ~/suns-dataset/control_flow_recovery/analysis/tools/ghidra-xrefs
./build
cd ~/suns-dataset/control_flow_recovery/analysis/tools/angr-cfg
./build
cd ~/suns-dataset/control_flow_recovery/analysis/tools/jakstab-cfg
./build
cd ~/suns-dataset/control_flow_recovery/analysis/tools/sja
./build
Running Analysis
After you've built the tools, you can run ./analyze in suns-dataset/control_flow_recovery/analysis. You can use the --help option to see the options available.
In general, you should run analyses on programs you have built. If you're following the example, this would be as simple as ./analyze --only_cfr enya-fptr_array-stripped. Note, you must use the name of the CFR file with the -cfr.json part stripped away.
The results can be found in results/ in the same directory.
Examples
Finding Difficult Call and Target Addresses Using GDB